36-Mise en forme
Mise en forme
Traduction du texte:
Faire une copie du fichier 6hrs.txt vers votre disque dur avec le logiciel WinSCP. Puis renommer le fichier en 6hrs_fr.txt et le copier dans le répertoire template.

Éditer le fichier 6hrs_fr.txt en faisant un clique droit sur le fichier et éditer.
Changer les textes en français.
<table border="1" rules="all">
<col />
<col />
<col align="char" char="." />
<col align="char" char="." />
<col />
<col />
<col align="char" char="m" />
<col align="char" char="m" />
<col align="char" char="." />
<col align="char" char="," />
<tr>
<th colspan="2" rowspan="2">Date & Heure</th>
<th rowspan="2">Température</th>
<th rowspan="2">Température ressentie</th>
<th rowspan="2">Humidité</th>
<th colspan="3">Vent</th>
<th rowspan="2">Pluie</th>
<th rowspan="2">Pression</th>
</tr>
<tr>
<th>Dir</th>
<th>Moyenne</th>
<th>Rafale</th>
</tr>
#timezone local#
#roundtime True#
#hourly#
#jump -6#
#loop 7#
<tr>
<td>#idx "%Y/%m/%d" "" "[None, x][x.hour == 0 or loop_count == 7]"#</td>
<td>#idx "%H:%M %Z"#</td>
<td>#temp_out "%.1f °C"#</td>
<td>#calc "apparent_temp(data['temp_out'], data['hum_out'], data['wind_ave'])" "%.1f °C"#</td>
<td>#hum_out "%d%%"#</td>
<td>#wind_dir "%s" "-" "wind_dir_text[x]"#</td>
<td>#wind_ave "%.0f km/h" "" "wind_kmph(x)"#</td>
<td>#wind_gust "%.0f km/h" "" "wind_kmph(x)"#</td>
<td>#rain "%0.1f mm"#</td>
<td>#rel_pressure "%.1f hPa"#, #pressure_trend "%s" "" "pressure_trend_text(x)"#</td>
</tr>
#jump 1#
#endloop#
</table>
Faire une sauvegarde. Téléchargement du template ici
Créer un fichier data_fr.php
<html xmlns="http://www.w3.org/1999/xhtml">
<head>
</head>
<body>
<?php
require_once('data/6hrs_fr.txt');
?>
</body>
</html>
Faire un transfert sur votre serveur.
Éditer le fichier weather.ini pour ajouter le template 6hrs_fr.txt et sauvegarder.

Puis faire un lien sur votre site.
Voilà le résultat ici Lien
Ajout des données graphiques. Pour la traduction en français faire à l'identique du template ci-dessus.
Traduction template 7days.png.xml:
<?xml version="1.0" encoding="ISO-8859-1"?>
<graph>
<size>600, 800</size>
<duration>weeks=1</duration>
<xformat>%d</xformat>
<dateformat></dateformat>
<plot>
<yrange>-10, 35</yrange>
<source>hourly</source>
<subplot>
<colour>1</colour>
<title>Température (°C)</title>
<ycalc>data['temp_out']</ycalc>
</subplot>
<subplot>
<colour>3</colour>
<ycalc>dew_point(data['temp_out'], data['hum_out'])</ycalc>
<title>Point de rosé (°C)</title>
</subplot>
</plot>
<plot>
<title>Vitesse du vent (km/h)</title>
<yrange>0, 30</yrange>
<source>hourly</source>
<subplot>
<colour>4</colour>
<ycalc>wind_kmph(data['wind_gust'])</ycalc>
<title>Rafale</title>
</subplot>
<subplot>
<colour>3</colour>
<ycalc>wind_kmph(data['wind_ave'])</ycalc>
<title>Moyenne</title>
</subplot>
</plot>
<plot>
<yrange>0, 5</yrange>
<source>hourly</source>
<subplot>
<colour>5</colour>
<style>box</style>
<xcalc>data['idx'].replace(minute=30, second=0)</xcalc>
<ycalc>data['rain']</ycalc>
<title>Pluie en une heure (mm)</title>
</subplot>
</plot>
<plot>
<source>hourly</source>
<subplot>
<colour>2</colour>
<ycalc>data['rel_pressure']</ycalc>
<title>Pression (hPa)</title>
</subplot>
<yrange>960, 1050</yrange>
</plot>
</graph>
Téléchargement du template ici
Intégration dans un fichier php:
<html xmlns="http://www.w3.org/1999/xhtml">
<head>
</head>
<body>
<?php
require_once('data/6hrs_fr.txt');
?>
<p><img src="data/7days.png" alt="" title=""/></p>
</body>
</html>
Voilà le résultat ici Lien
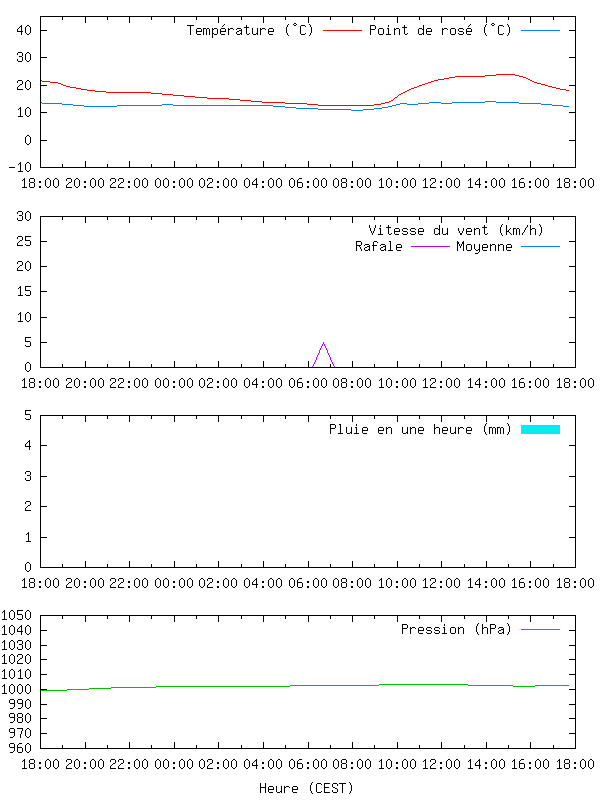
Modification du template 24hrs.png.xml
<?xml version="1.0" encoding="ISO-8859-1"?>
<graph>
<size>600, 800</size>
<duration>hours=24</duration>
<xtics>2</xtics>
<xformat>%H:%M</xformat>
<dateformat></dateformat>
<plot>
<yrange>-10, 35</yrange>
<source>raw</source>
<subplot>
<colour>1</colour>
<title>Température (°C)</title>
<ycalc>data['temp_out']</ycalc>
</subplot>
<subplot>
<colour>3</colour>
<ycalc>dew_point(data['temp_out'], data['hum_out'])</ycalc>
<title>Point de rosé (°C)</title>
</subplot>
</plot>
<plot>
<title>Vitesse du vent (km/h)</title>
<yrange>0, 30</yrange>
<source>raw</source>
<subplot>
<colour>4</colour>
<ycalc>wind_kmph(data['wind_gust'])</ycalc>
<title>Rafale</title>
</subplot>
<subplot>
<colour>3</colour>
<ycalc>wind_kmph(data['wind_ave'])</ycalc>
<title>Moyenne</title>
</subplot>
</plot>
<plot>
<yrange>0, 5</yrange>
<source>hourly</source>
<subplot>
<colour>5</colour>
<style>box</style>
<xcalc>data['idx'].replace(minute=30, second=0)</xcalc>
<ycalc>data['rain']</ycalc>
<title>Pluie en une heure (mm)</title>
</subplot>
</plot>
<plot>
<source>hourly</source>
<subplot>
<colour>2</colour>
<ycalc>data['rel_pressure']</ycalc>
<title>Pression (hPa)</title>
</subplot>
<yrange>960, 1050</yrange>
</plot>
</graph>
Visualisation de l'image Voici le résultat ici Lien
Téléchargement du template ici
Téléchargement de tous mes templates
Mise à jour 06/02/2013
Créé avec HelpNDoc Personal Edition: Produire facilement des livres électroniques Kindle